How to Data Log a MEMS3 ECU
Download
Link: https://andrewrevill.co.uk/Downloads/MEMSTools.zip
Instructions for getting started with
MEMS Mapper and data logging a MEMS3 ECU.
NB: I no longer
generally supply the mini CD when I sell cables. The CDs come with the cables
when I buy them, but lately I have sometimes found them to contain unnecessary or
confusing VAG software tools and/or potentially unwanted or damaging programs.
So I now remove the CDs for your protection and supply these instructions which
guide you through the process of downloading and installing the software and
drivers from my website, which is a much safer option. Please do not be
concerned when there is no CD in the bag with the cable, everything you need
can be downloaded for free online.
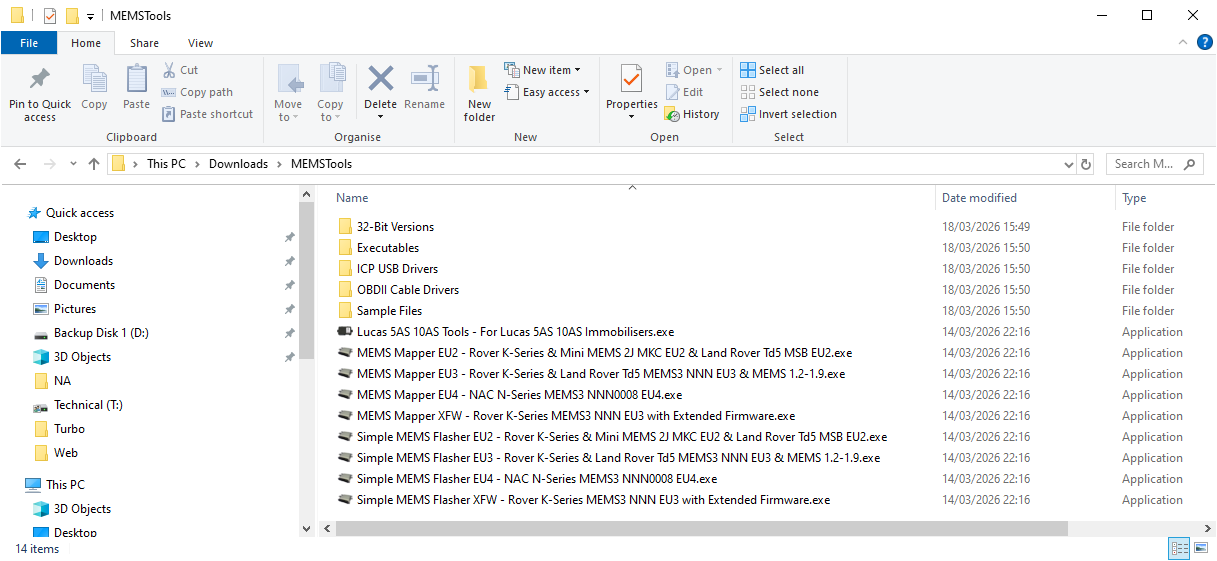
· Download MEMS Tools from the link at the top of this page. This will download a .ZIP file.
·
Extract the .ZIP file into a new empty folder
and the contents should look like this:
·
For a MEMS3 EU3 ECU, you need to launch
(double-click) the EU3 version of MEMS Mapper:
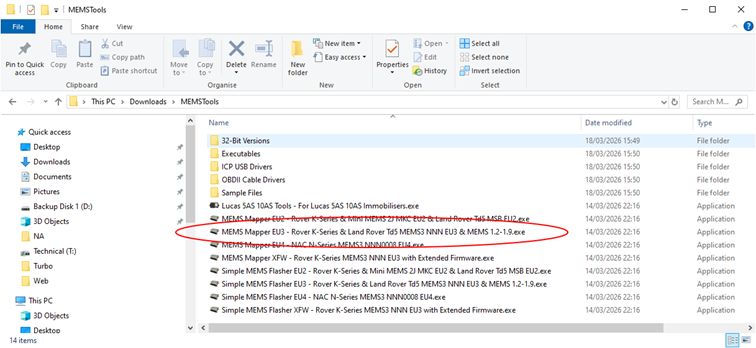
·
You should then see a window that looks like
this:
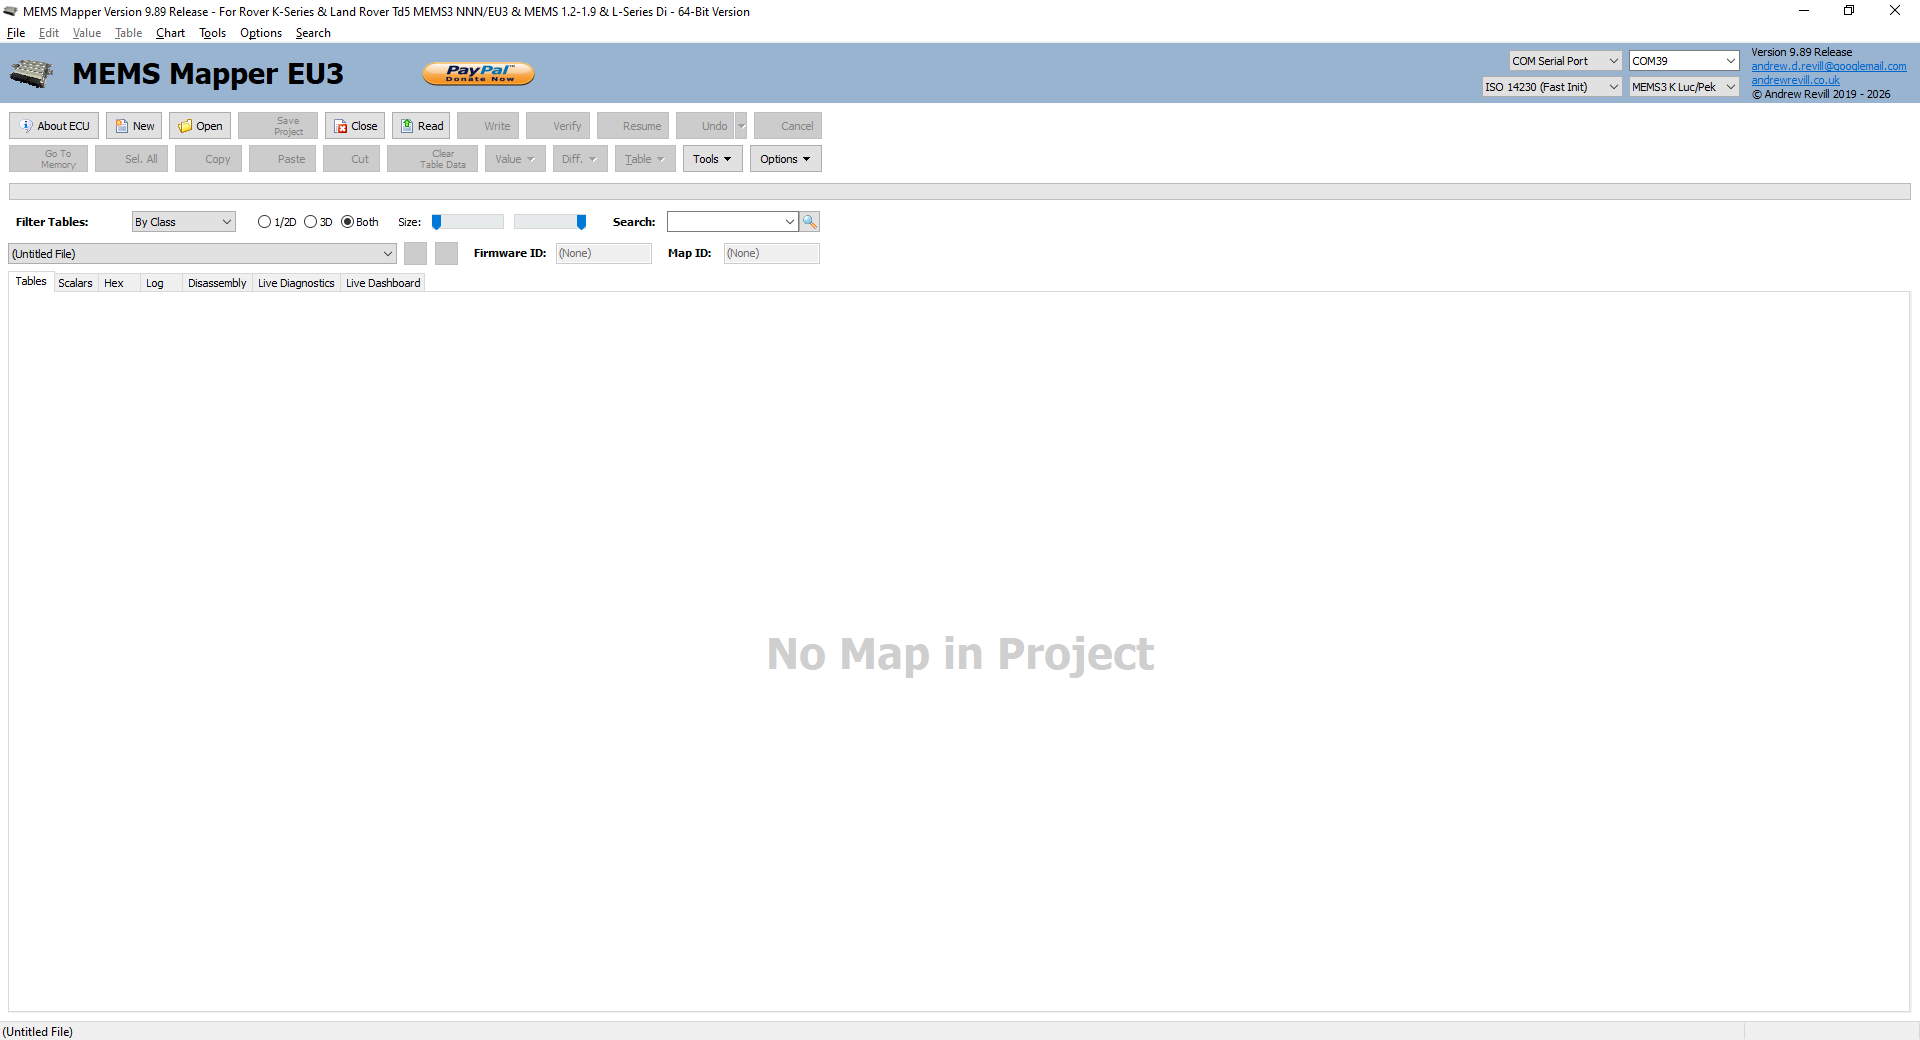
·
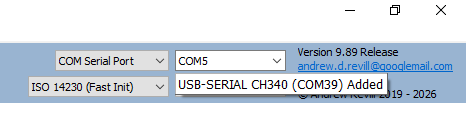
Plug your cable into a USB port on your
computer. You should see a popup like this, which tells you the COM port number
that Windows has assigned to your cable:
·
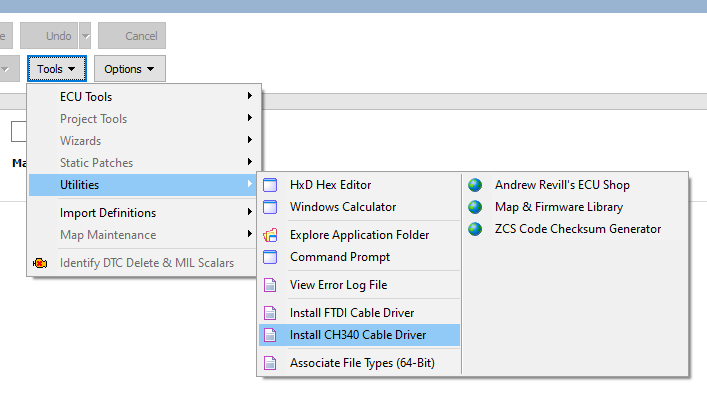
If you don’t see the popup, you may need to
install drivers for the cable. There are options to do this on the menu in MEMS
Mapper. If it’s a cable bought from me, you will need the CH340 driver. For
other cables, you may need the FTDI driver instead. These menu items launch the
chip manufacturer’s own driver installation program.
·
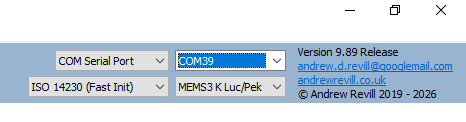
Now select the COM port which Windows has
assigned to your cable as shown here:
·
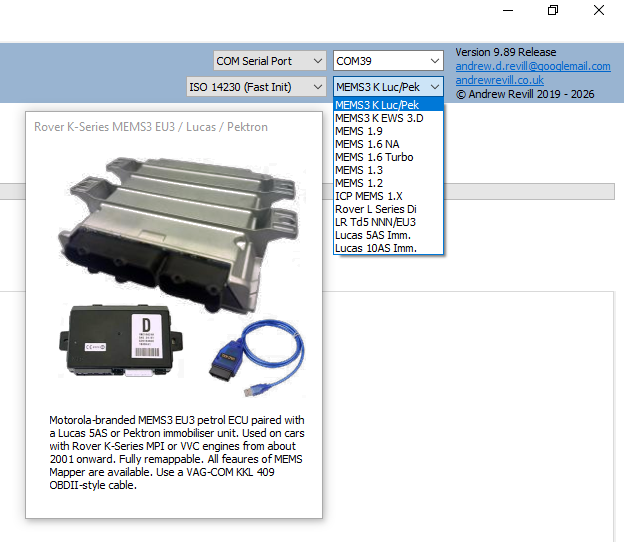
Make sure you have to correct ECU type selected
here:
·
Click About ECU:
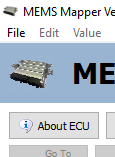
·
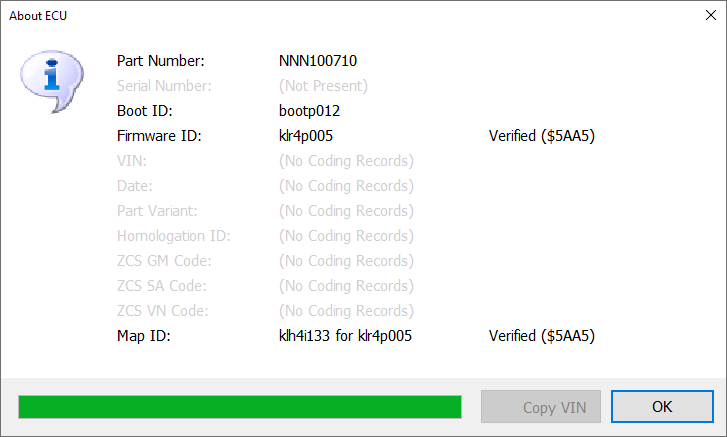
If everything is set up correctly and you are
connected to the ECU, you should see a box of information about the ECU like
this:
· You are now ready to view Live Diagnostics, fault codes and to data log the ECU (record the Live Diagnostics data and save to a file).
·
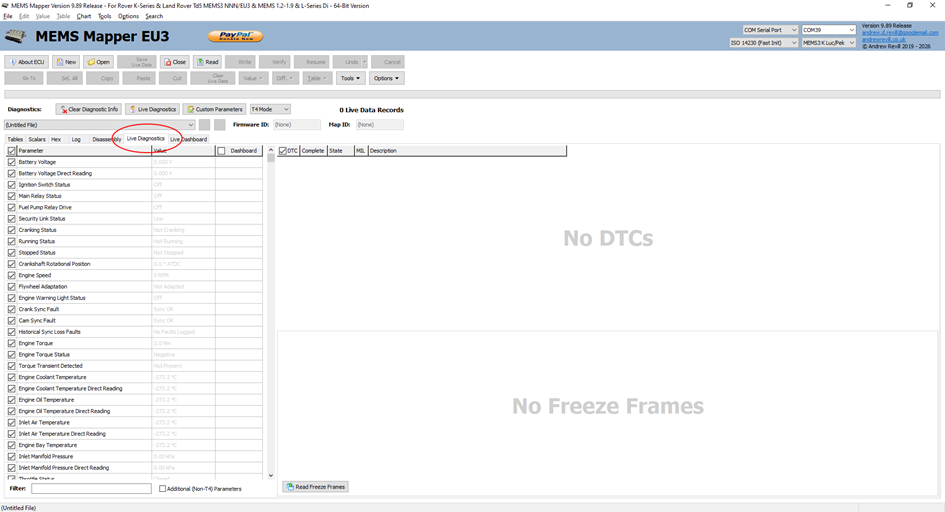
In MEMS Mapper, click into the Live Diagnostics
tab:
·
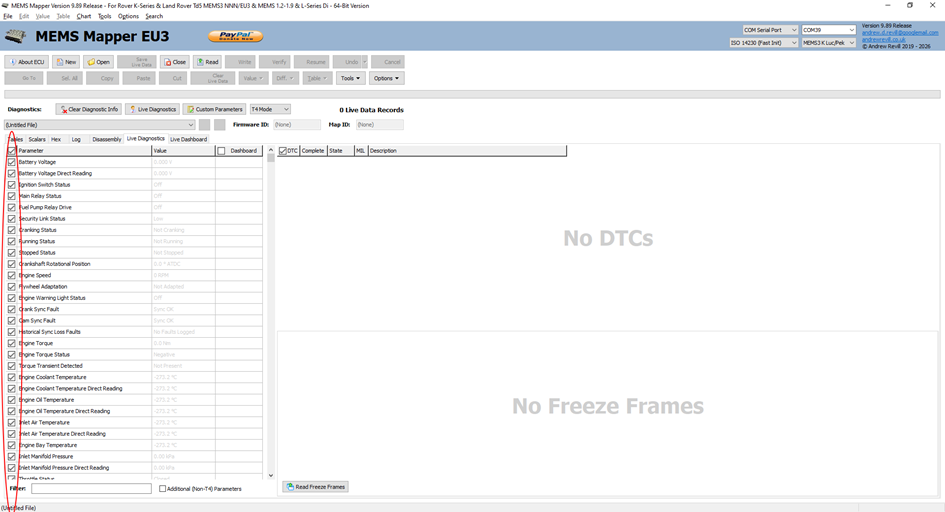
Here you can select which data measures you want
to view and log. The more you select, the slower it will update, as it has more
information to read each time around. By default everything will be selected to
start with:
·
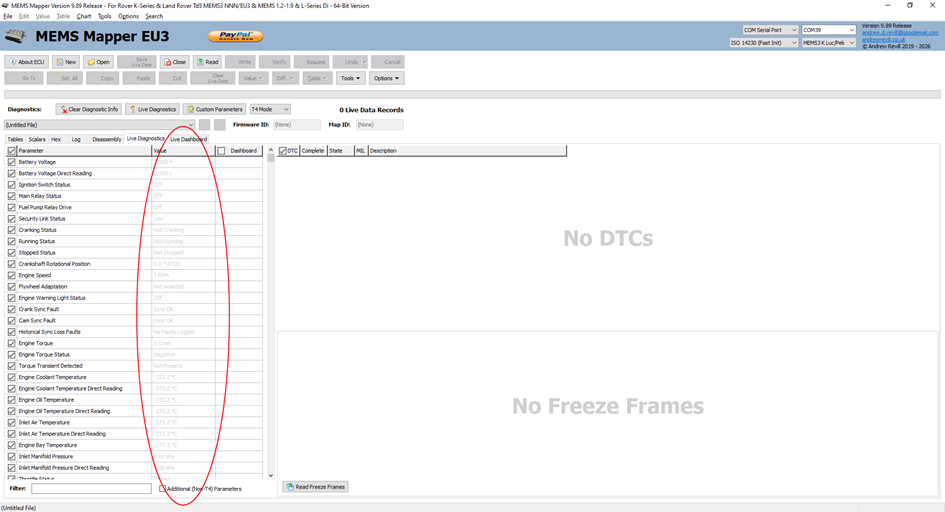
Live data values will show here. At the
moment they're all shown in grey, because it's not running and the values are
not live / up to date:
·
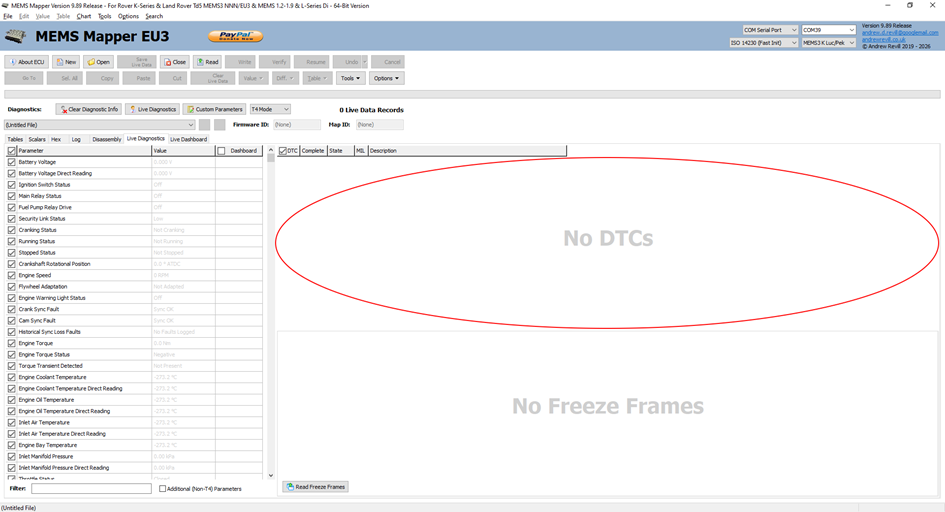
Fault codes will show here:
·
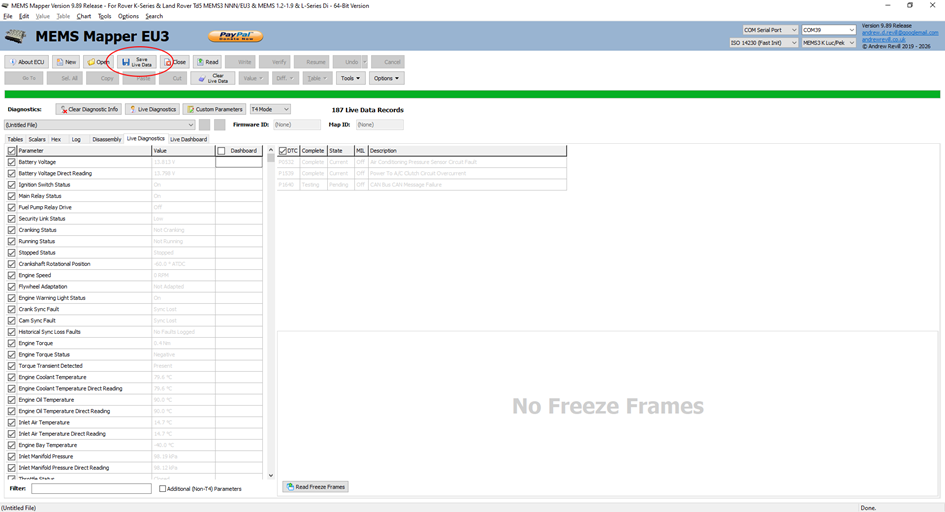
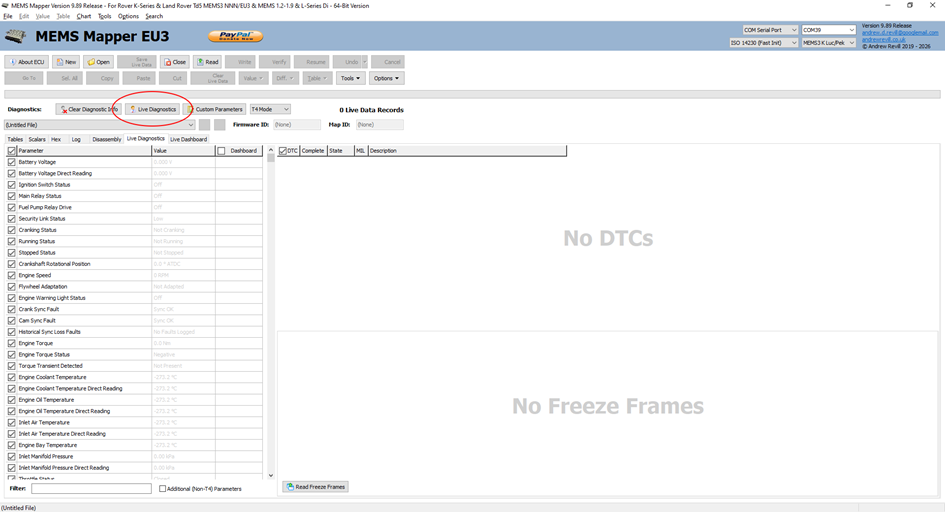
To start displaying and
recording live data, click here:
·
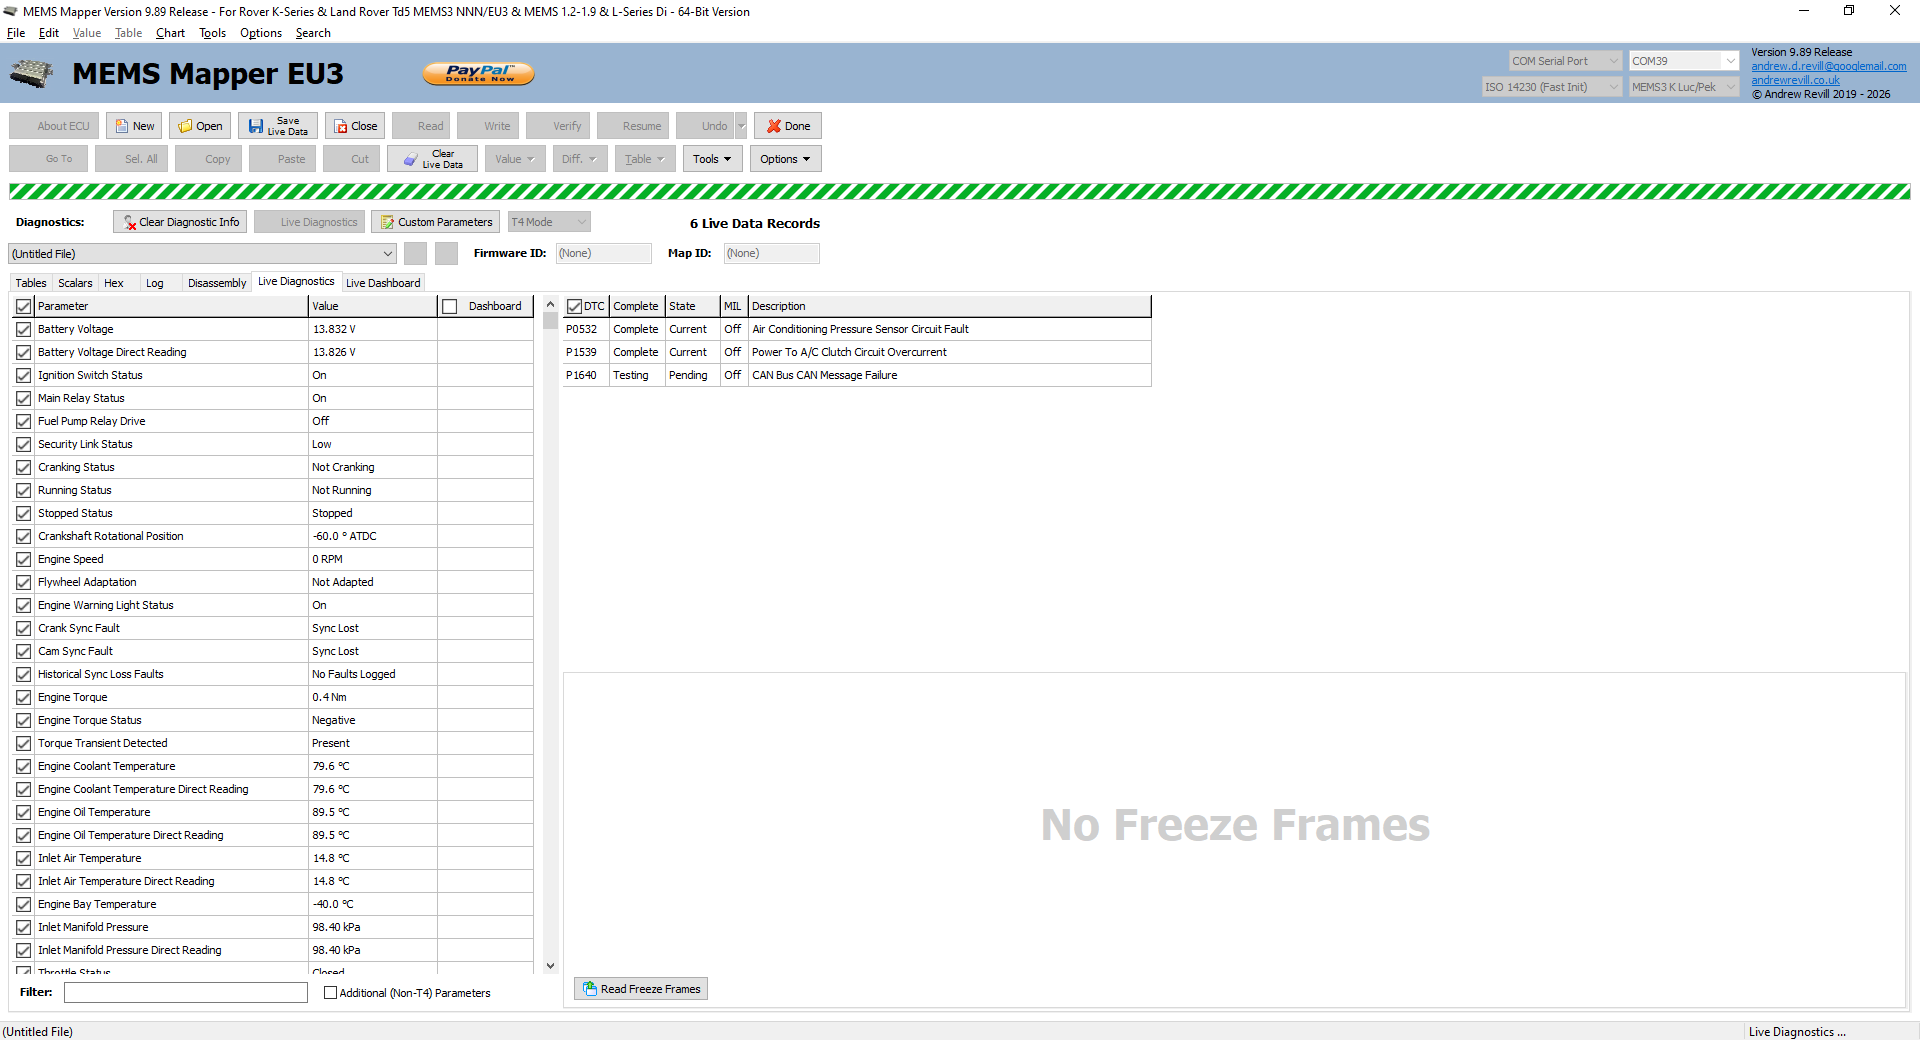
It should then start showing live data
values. It will also update the DTC fault codes about once every 10 seconds.
The live data will updated about once a second with everything
selected or faster with fewer measures selected. All of the values displayed
are logged to memory in the background while it is running:
·
When you've finished
with Live Diagnostics, click Done here:
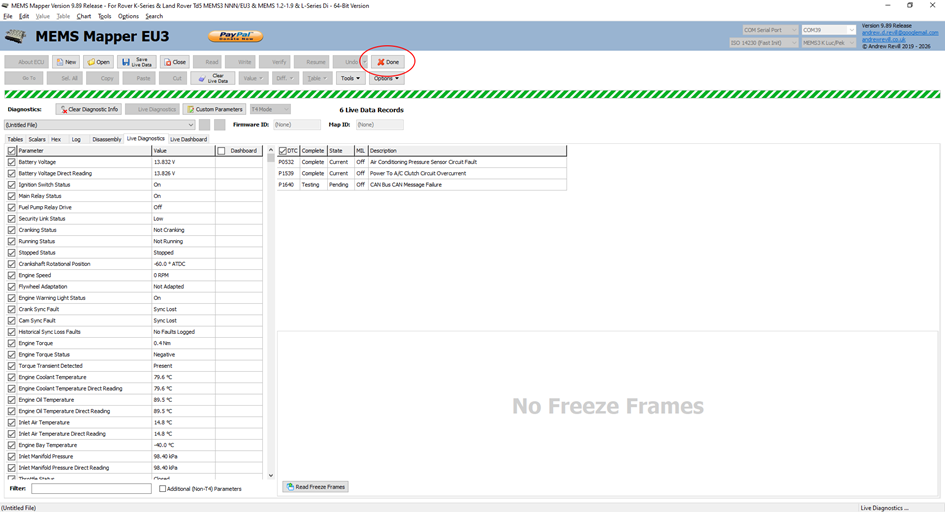
·
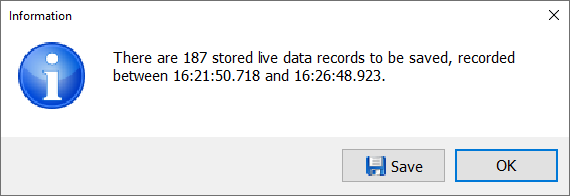
You will then be asked whether you want to save
the live data recorded:
·
You can also save the live data or fault codes
afterwards by clicking on one grid or the other, then clicking Save Live Data
here: