High Speed Data Logging and Live
Dashboard for MEMS3
Download
Link: https://andrewrevill.co.uk/Downloads/MEMSTools.zip
My MEMS Mapper now allows diagnostic
data to be displayed at high refresh rates and as a virtual dashboard.
In my recent article TestBook T4 (Main Dealer) Level Support for MEMS3 I described how I had added detailed diagnostic information display to my free MEMS Mapper application.
This displayed anything up to over a hundred different parameters. The interface used to the ECU was the same as that used by the TestBook T4 system, and made use of data records which you can request from the ECU using a set of standard “Local Identifiers”. Each local identifier record contains a number of different fields which contain the different live data parameters. The problem with this is that, even if you only want to display or log a small number of parameters during any particular diagnostic task, they are probably taken from different standard records and therefore you end up pulling down a lot of different records and a lot of data that you don’t need. This makes the refresh rates relatively slow.
I’ve now added a new “High Speed” data logging mode, which provides much higher refresh rates. This works by defining custom local identifier records on the ECU, containing only the data required. For small numbers of parameters, refresh rates of up to 15 frames per second are possible. This gets you a lot closer to being able to monitor the engine in near real-time.
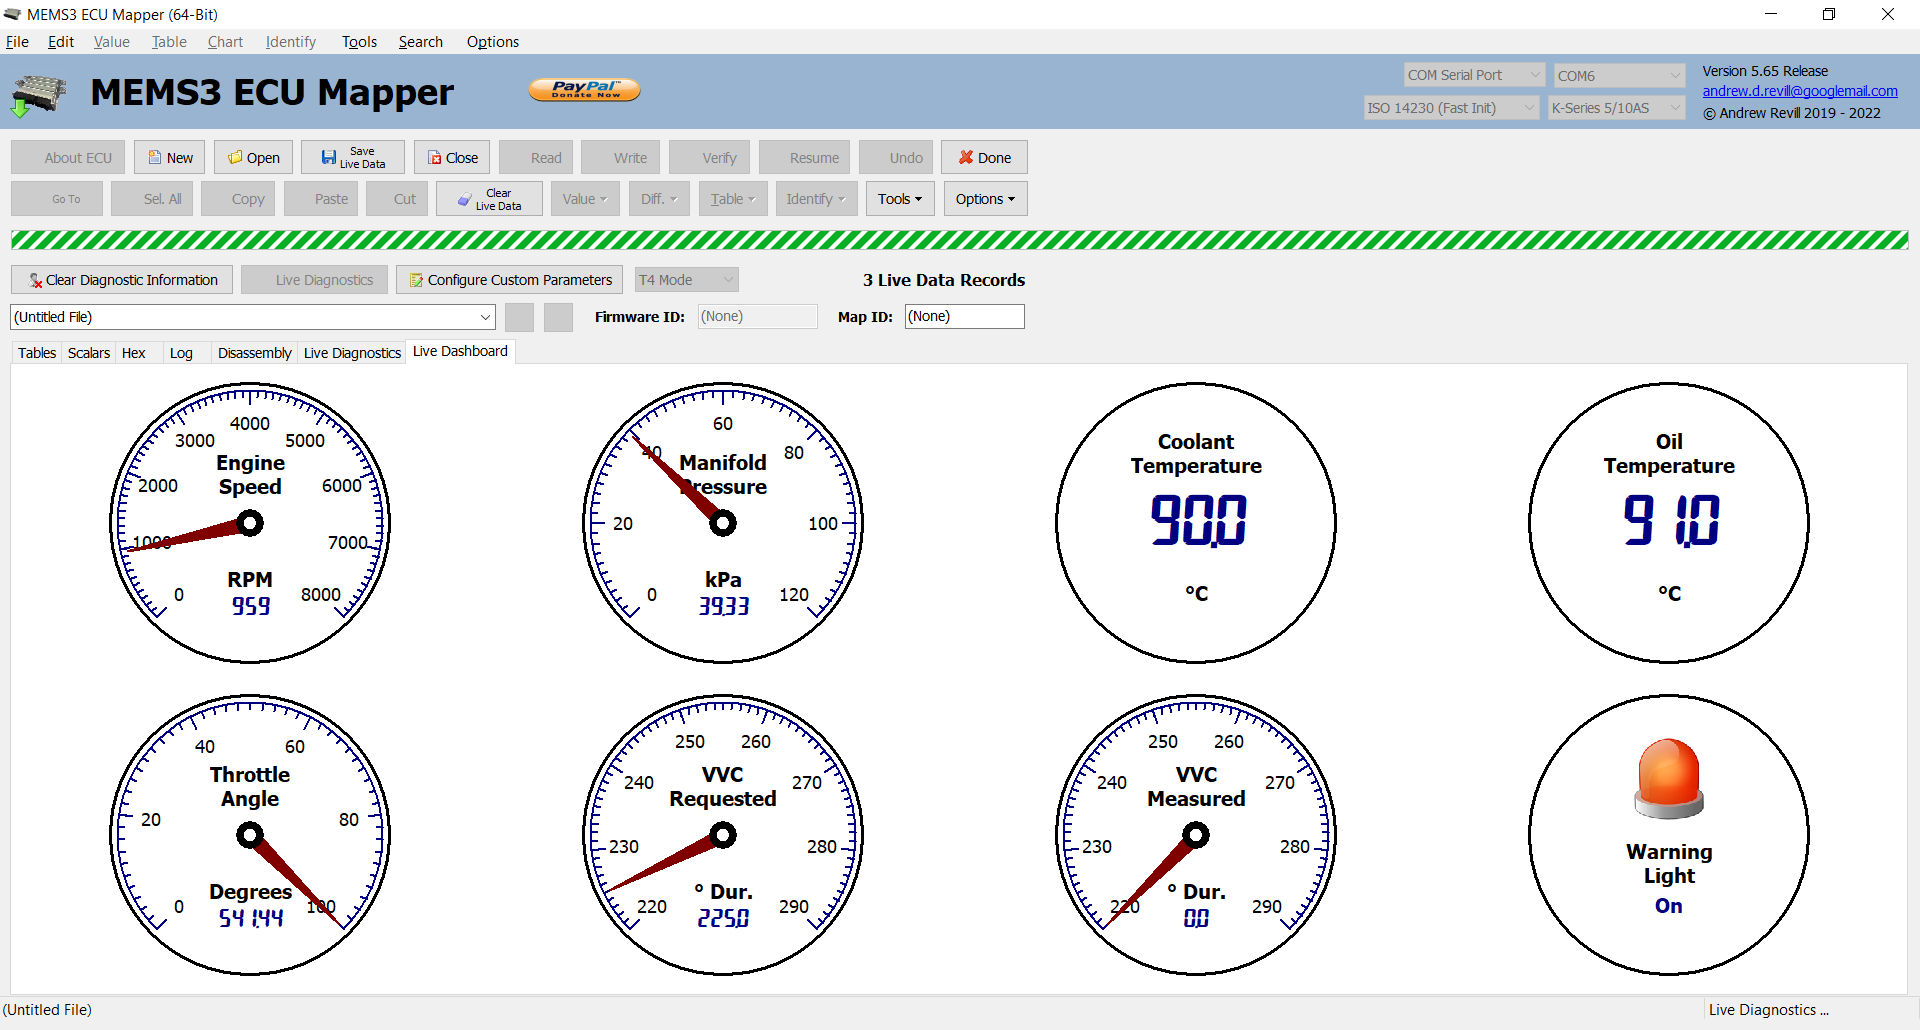
I’ve also added a new “Live Dashboard” feature, which allows any of the parameters to be displayed live on analog gauges, digital numeric displays or LED indicators.

This short
video shows the live dashboard in use on my car, using both T4 (first part of
the video) and High Speed (second part of the video) modes for comparison. You
can see that the new High Speed mode provides a much better refresh rate which
makes it a lot easier to see what is going on with the engine: https://www.youtube.com/watch?v=u6s53bujaDU
HOW IT WORKS
The KWP2000 standard define a service $2C “Dynamically Define Local Identifier”. This is intended for use in this particular case, but the ECU doesn’t fully implement the standard. It implements a limited subset and deviates from the defined standard in ways described below. Through a combination of experimentation and digging around in the disassembly of the firmware code, I was able to figure out what would and what would not work and to put together a workable solution. Note that all of this uses standard ECU functionality and does not need any additional firmware patches:
· The standard allows up to 10 dynamically defined local identifier records, with identifiers $F0 to $F9. In theory you can define and delete any number of these independently. However due to memory limitations, MEMS3 only allows one dynamically local identifier record to be defined at any one time. This can have any identifier from $F0 to $F9, however there’s an odd restriction; once you’ve used one identifier, even if you delete that definition, you cannot use any other identifier (until the ECU is next rebooted). So you need to pick one identifier and stick with it. So long as you stay with the same identifier, you can define and delete it as many times as you want.
· The standard places no restriction on the number of fields you can place in a single record. This is left up to the specific implementation on any given ECU. Some of the static records defined by the ECU contain up to 23 fields. Dynamically defined records on MEMS3 however are limited to 10 fields maximum.
· The standard allows for 4 different “definition modes” for each field. In theory you can mix and match the different definition modes in a single record, using a different mode to specify each field:
o Mode 1: Define by Local Identifier – This assumes that the ECU has a number of pre-defined fields, each of which has an identifier, and you specify the identifier of the field you want.
o Mode 2: Define by Memory Address – This allows you to specify the memory address and size of each field, anywhere within the internal address space of the ECU. Typically manufacturer implementations specify that Mode 2 is for development use only and must be removed in production ECUs.
o Mode 3: Define by Identifier – This allows you to pick and choose from fields in existing pre-defined records. So you can specify for example “existing record $12, field 3”.
o Mode 4: Clear Dynamically Defined Local Identifier – This is used to delete previously defined identifiers.
It took a bit of effort to figure out what the ECU supports here. It turns out that it effectively that it supports Mode 1 and Mode 4 only – but the odd twist is that the identifiers used for each field are actually their memory addresses and sizes, so it is effectively using Mode 2, but calling it Mode 1 for some reason! The syntax of all the messages you need to pass to the ECU follow the Mode 2 standard closely, except that you have to pass the mode identifier as 1, not 2.
· The ECU will not tolerate incorrect or invalid definition requests, requests which use other unsupported modes etc. If you try to define a record using any of these, not only will the request fail but you are likely to be left in a situation where the record cannot even be deleted or redefined, so you have to be very careful to make sure that all requests passed follow the ECU’s specific requirements exactly.
Following the above guidelines, it is possible to dynamically define (and then delete and redefine at will) a single local identifier record containing up to 10 fields, which can be anything you want.
This does, however, imply a couple of interesting capabilities and one problem:
· Capability: Because you can define a field as being at any arbitrary memory address and any arbitrary length, you can actually include more than 10 fields where fields are consecutive in memory. You can even stretch this a bit where fields are not quite consecutive, for example the four injector pulse width variable are each 2 bytes in size and have 2 bytes spacing between them. You can pull all of these down as a single field in the record by defining it as one field of length 14 bytes, which gets you the 4 variables you want and 6 bytes you can ignore. The limit on how far you take this is the limit on the length of the message returned by the ECU.
· Capability: You can define custom parameters which are not even supported by the standard local identifier records. Anything you know the memory address of, you can define as a custom parameter and display or log it like any other. This is very useful for me when investigating the internal workings of the ECU as I can watch internal variables in real time.
· Problem: You need to know the internal memory addresses of all of the ECUs variables which hold the various parameters. As these will be different on every different firmware version (of which there are very many), this is not something I can solve just by working out the addresses and coding them into the tool.
The ECU firmware contains a table used by the code that generates the pre-defined local identifier records. This table contains the identifiers of the records and the definitions of the fields which they contain, including the memory addresses. It would therefore be possible to analyse the ECUs firmware on the fly, locate the functions which handle the OBDII requests for local identifier records, from those work out the address of the table, then scan the table to get the addresses of the variables corresponding to the fields (the actual list of fields in each record is pretty much fixed across all MEMS3 firmware versions, except for some records which are only proved by ECUs which support them, so automatic ECUs support some records not provided by manual ECUs and VVC ECUs support some records not provided by MPI ECUs).
This would however be very slow, as it would require the ECU’s full firmware to be read each time you wanted to start a diagnostic session. So instead, I’ve added a simple requirement: In order to use High Speed mode, you must have a project file loaded into MEMS Mapper which contains the same firmware ID as the ECU. The code then performs the following steps when starting a diagnostic session:
· It reads the firmware ID from the ECU and compares it with that of the current project. If they match, it assumes that the ECUs firmware (or at least the parts it needs to analyse) will be the same as the project.
· It scans the ECU firmware looking for the instructions used to address the local identifier table. For each such instruction found:
o Finds the address of the potential table.
o Scans the table at the given address, verifying that it meets the requirements of the local identifier definition table. If it really is the local identifier table it will meet the following stringent requirements:
§ It will be properly formatted series of records definitions, followed immediately by an end-of-table marker.
§ Each record definition will be a properly formatted series of field definitions.
§ It will not define any duplicate record IDs.
§ It will at least contain the definitions of record IDs $00, $06, $0A, $0B, $0C, $10, $11, $12, $13, $14, $15 and $21 which are supported by all ECUs.
· Once it has found the local identifier table, it uses the definitions of all of the pre-defined parameters (which position they appear at in which record) to lookup their memory addresses and sizes.
· The first 10 parameters selected are packed into a custom local identifier record. Priority is given to custom defined parameters as these can only appear in the custom record. Priority is then given to parameters which are consecutive in memory. Any remaining spaces in the custom record are then filled with other parameters. Any remaining parameters are then downloaded using the standard records.
There is one other restriction which I’ve had to place on the use of High Speed mode. It turns out that the small block of RAM used to store the custom record definition lies in the middle of a larger block of RAM which is otherwise unused in normal operation, and which I have used for storing live table data in my Live Mapping patch. Defining custom local identifier records with the Live Mapping patch installed would then corrupt table data. I have therefore updated my Live Mapping patch to intercept the request messages used to define custom local identifier records and block them, returning a negative response. So High Speed mode and the use of custom parameters are neatly disabled when the Live Mapping patch is installed. It is still possible to perform live diagnostics with the Live Mapping patch installed in T4 Mode, provided that no custom parameters are both configured and selected.
HOW TO USE HIGH SPEED
MODE
As a user you don’t need to know any of the above in order to use high speed mode. Just make sure you have a project open which matches the firmware version of the ECU (it will prompt you if you don’t), then select “High Speed” instead of “T4 Mode” in the combo box at the top of the screen before starting Live Diagnostics (you can even switch once the Live Diagnostics are already running) and it will run at the best speed possible.
By default, when you first load MEMS Mapper, live DTCs are enabled and all available parameters are selected for live diagnostics. When you switch to High Speed mode, live DTCs are turned off. You can turn them back on, but it runs faster with them off as they are just more information to download from the ECU. The tool does however prioritise live data parameters in High Speed mode, only updating the DTCs every now and again, not in every frame. Also, which switching to High Speed mode, if it detects that all available parameters are selected it clears the selection ready for you to select the subset of parameters you want to see. If it detects that a selection has already been made, it doesn’t clear it.
CUSTOM PARAMETER
DEFINITIONS
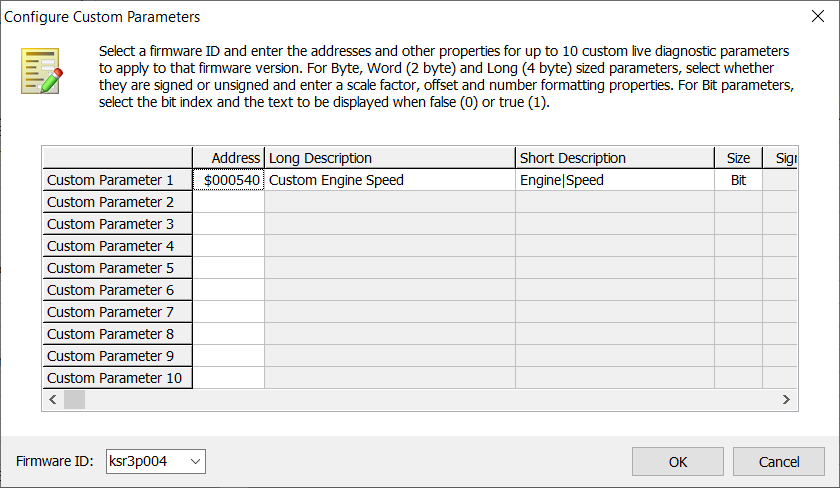
Clicking Configure Custom Parameters brings up the following dialog. This is probably mainly useful to me, but I’ve described it here for completeness and it’s there to be used if you want to play with it. This allows you to define up to 10 custom parameters which may then be logged or displayed along with the standard parameters. These are defined by memory address, which will be specific to a firmware ID. A combo box at the bottom of the dialog allows you to select the firmware ID for which you are defining custom parameters (the default being the firmware ID for the current project).

For each custom parameter you can specify:
· Address: The RAM memory address of the variable which stores the parameter.
· Long Description – This is used in the Live Diagnostics tab.
· Short Description – This is used on instruments on the Live Dashboard tab.
· Size – Bit, Byte, Word or Long. Click or press any key to toggle.
· For Byte, Word or Long sized parameters:
o Signed – Either Signed or Unsigned. Click or press any key to toggle.
o Scale – Multiplied by the raw value before displaying. Used to format things like temperatures stored in units of 0.1 °K to °C.
o Offset – Added to the raw value before displaying. Used to format things like temperatures stored in units of 0.1 °K to °C.
o Prefix – Prefix used for displayed values.
o Suffix – Suffix used for displayed values.
o Unit – Unit of measure used both on the Live Diagnostics table and on instruments on the Live Dashboard tab.
o Min – Either Auto or Fixed. Click or press any key to toggle. Where Auto is specified, the minimum scale value on analog gauges on the Live Dashboard tab will expand to accommodate out of range values.
o Min Value – The initial minimum value used for analog gauges on the Live Dashboard tab.
o Max – Either Auto or Fixed. Click or press any key to toggle. Where Auto is specified, the maximum scale value on analog gauges on the Live Dashboard tab will expand to accommodate out of range values.
o Max Value – The initial maximum value used for analog gauges on the Live Dashboard tab.
· For Bit sized parameters:
o Bit – The bit number 0-7 in the byte at the given address.
o False Text – The text displayed when the bit is 0.
o True Text – The text displayed when the bit is 1.
o Color – Either Red, Yellow, Blue or Green. Click or press any key to cycle. The LED color used on the Live Dashboard tab. To be consistent with the colors used for standard parameters, I have used green for long term on/off type conditions to show where things have started, yellow for transient on/off conditions, red for faults and errors and blue for things which cycle regularly like lambda sensor switch state and security link signal.
LIVE DASHBOARD
In order to help visualise what is happening with an engine, you can now display any subset of the parameters selected for live diagnostics on a live dashboard. Numeric parameters may be displayed as either an analog gauge or a digital numeric display. Bit flag parameters may be displayed as LED indicators. There is no limit on the number of instruments displayed on the dashboard. They are automatically resized and display on a grid which is laid out to maximise the size of each instrument. New instruments are added last, but you can drag and drop the instruments into any order you like.
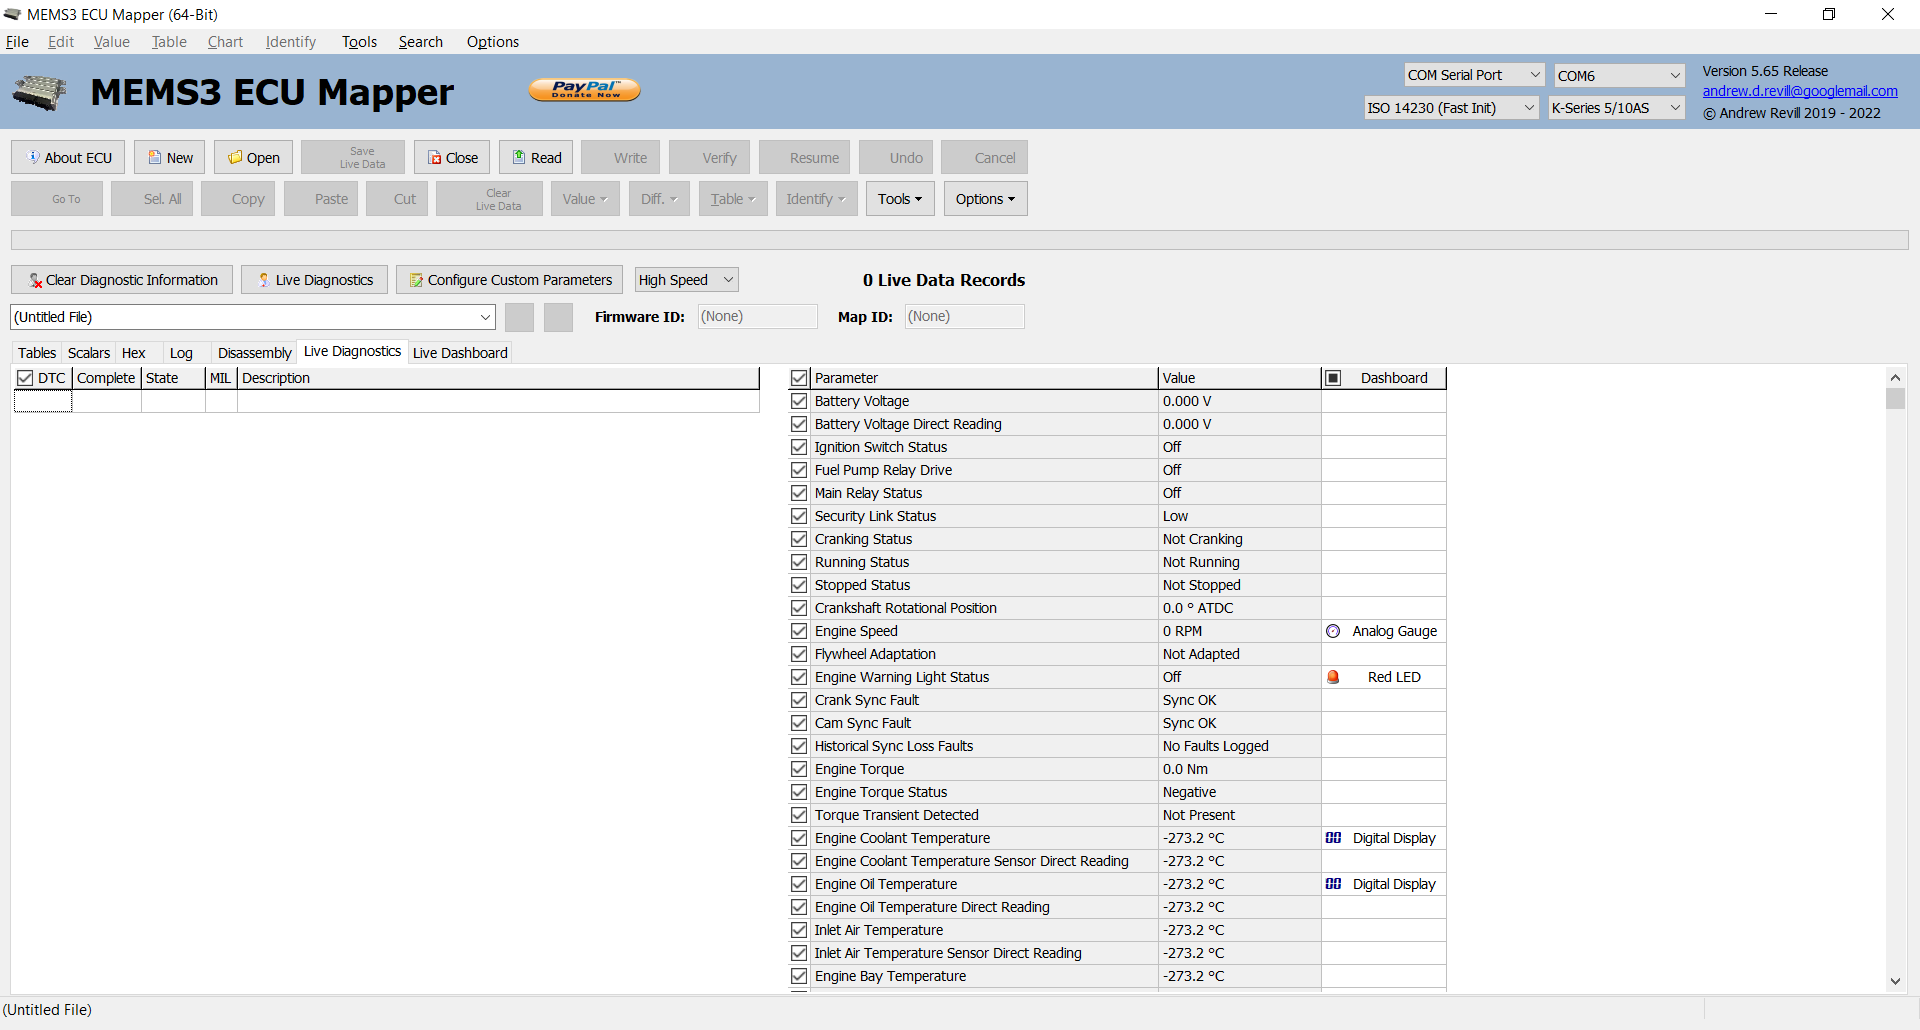
On the Live Diagnostics tab there is a new column which lets you select what instruments you want to include on the Live Dashboard tab.

Click on a cell, or highlight it and press any key to cycle through the different instrument types.
For numeric parameters it cycles through None, Analog, Digital, None …
For bit flag parameters it cycles through None, LED, None …
If you add an instrument to a parameter it is automatically selected it for live diagnostics. If you deselect a parameter, any instrument is removed.
The built-in definition for each parameter determines whether the minimum and maximum scale values are automatically expanded to accommodate out if range values or not. For example parameters like Battery Voltage and Engine Coolant temperature are initially scaled using sensible values, but will expand if higher or lower values are encountered. Parameters like VVC Inlet Cam Duration Requested use a fixed scale of 200° to 290° as these are the only values used by the ECU, but the value may be reported as 0 when the engine is not running and it doesn’t make sense to expand the gauge scale down to 0 because of this. The built-in definitions also determine the LED colors used.
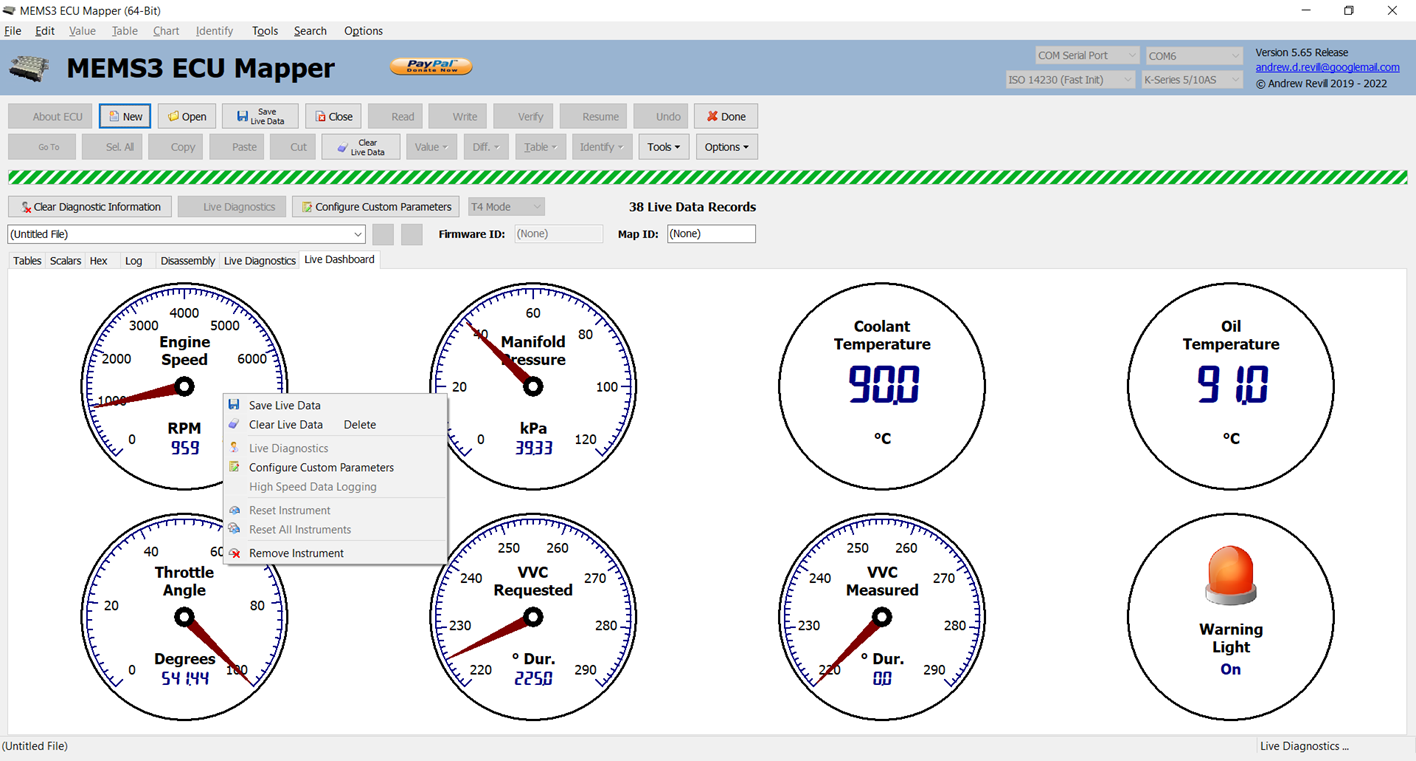
A popup menu on each instrument on the Live Dashboard tab allows you reset the instrument scales where appropriate.
