MEMS3 Debugging – Breakpoints with
Stack, Register & Variable Tracing on a Running ECU
Download
Link: https://andrewrevill.co.uk/Downloads/MEMSTools.zip
Coming from a software development background, I have always wanted to be able to debug the MEMS3 firmware in the same way as I would debug a piece of software I was writing. I really missed the ability to follow the program flow as it executed, inspecting the values of registers and variables at specific points. The new Debugging Patch for MEMS Mapper gets me a lot closer to where I wanted to be.
Using my MEMS Mapper application it
is now possible to add breakpoints and log detailed debugging information from
a running ECU.
My debugging system is now up and running properly. It’s all done with my dynamic patching system again, so MEMS Mapper can automatically patch all of this into any MEMS3 firmware version. It’s primarily for my benefit, but I’ve released it as part of the standard software package, so anyone who wants to have a play can. To avoid cluttering the menus with things that the average user isn’t going to find that useful, on the Options menu you need to check Enable Developer Features before the debugging system becomes available. Anything that you find in developer mode should be treated with a degree of caution as it was primarily written as a development resource for my benefit.
When you install the debugging patch into a project (select Tools, Project Tools, Install Debugging Patch from the menu) you are presented with the following dialog which allows you to configure the patch before writing the firmware to the ECU. You can reconfigure that patch at any time (using Tools, Project Tools, Configure Debugging Patch):
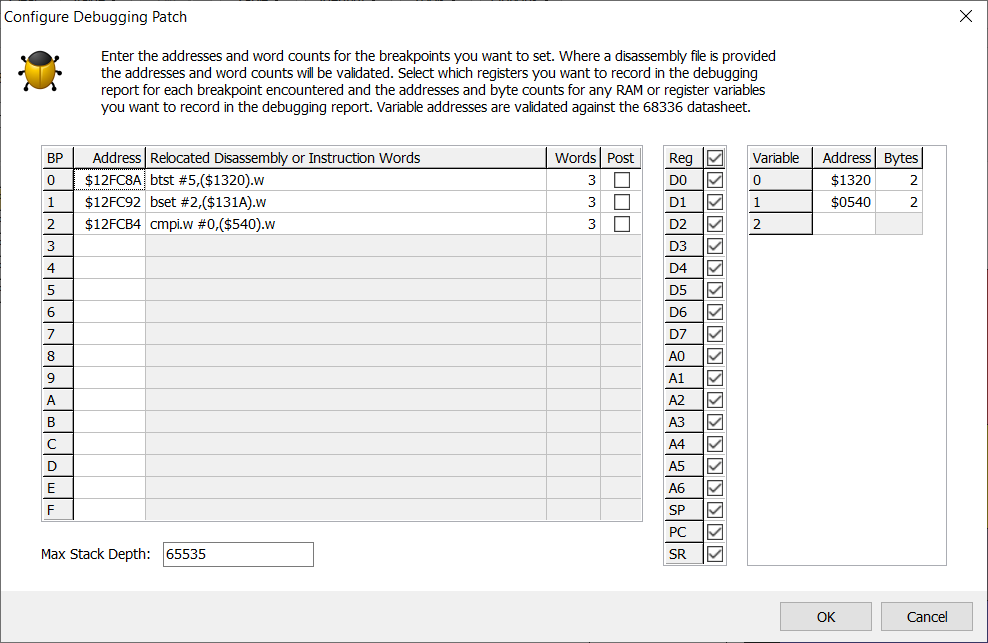
Breakpoints
The configuration dialog allows you to set up to 16 different breakpoints 0-F at arbitrary firmware addresses. For each breakpoint set, it displays the instructions at that address and calculates the number of words occupied by the instruction, provided that there is a disassembly file provided for the current firmware version. If no disassembly file is found, you can still set breakpoints but the tool cannot check your inputs. Setting a breakpoint at an address that is not the start of an instruction, or setting the number of words such that the breakpoint does not cover a whole number of complete instruction will almost inevitably result in a crash.
Where there is a disassembly file, the tool not only validates that breakpoint address corresponds to the start of an instruction, but it also verifies that the instructions covered by the breakpoint are relocatable. Internally it patches the firmware to replace the instruction at the breakpoint with a 1-word TRAP instruction, sets up a TRAP exception handler to do the logging and relocates the patched instructions to inside the handler. Inside the trap handler, the code ensures that all register contents and relevant memory contents are preserved so that the relocated instruction executes exactly as it would if the breakpoint were not present. It even rearranges the stack to ensure that if the instruction is inside a subroutine, or calls a subroutine, and that subroutine uses parameters passed on the stack or local variables on the stack, then everything will still execute correctly. Similarly, instructions which affect registers or condition code flags can be safely patched with breakpoints and the instruction will take effect as though it were executing inline.
You can patch jumps to subroutines; if these are done through JSR (which specifies an absolute address for the subroutine) than the instructions are patched in the same way as other instructions. If they are done through BSR (which specifies an offset relative to the address of the current instruction), these are rewritten and expanded into JSR instructions when relocating into the TRAP handler in order to ensure that they have the same effect. Instructions that cannot be patched with breakpoints are non-returning jumps and branches and those which directly access or manipulate the program counter or stack pointer.
Often code is written as test, followed immediately by a conditional branch on the results of that test. Because you cannot patch a breakpoint onto the conditional branch instructions, I’ve made it so you can set each breakpoint to be either Pre-Execution (by default, as for breakpoints in most programming languages where the breakpoint occurs immediately BEFORE the instruction to which it is applied) or Post-Execution (in which case the breakpoint occurs immediately AFTER the instruction to which it applies). This allows you to apply a Post-Execution breakpoint to the test instruction and see the results on which the conditional branch is made rather than having to place a Pre-Execution breakpoint on the branch instruction.
Logging
Because you cannot truly “break” execution on an intact ECU running an engine, the debugging patch logs all of the debugging information in the unused RAM block that I used for the live mapping patch. I did spot a slight hiccup with this, which affected the live mapping patch too; while investigating Service 33 “Dynamically Define Local Identifier” for the live data logging, I noticed that if you call that it sticks the record definitions in memory in the 0x1AXX range, which is RAM that is otherwise unused and marked for live mapping. So I’ve now blocked the use of Service 33 when either my live mapping or debugging patches are installed. I haven’t yet managed to find out how to make Service 33 work properly anyway, and even TestBook doesn’t seem to use it, so it won’t be a problem disabling it with the patch installed for now.
To maximise the amount of info it can fit in the available RAM, you can configure what information you want to log each time a breakpoint is executed. You can select which registers you want to record and the maximum stack depth to trace. You can also specify an arbitrary number of memory variables of arbitrary sizes to log each time a breakpoint is executed.
In total, the debugging patch records the following:
· The total number of breakpoints executed (up to 32768 – the top bit is used as an overflow flag, so once it hits 32768 the count stops and it reports “32768 (or more)” breakpoint hits.
· The number of times each defined breakpoint 0-F is executed (counted as above).
· The sequence in which the breakpoints were executed. So it will report say 0, 4, A to tell you that it executed breakpoint 0, then 4, then A. These are packed into 4 bits per execution. It will record the sequence of the first 256 breakpoints hit in 128 bytes of RAM. After that it just sets an overflow flag and the report shows “... and N more”.
· For each breakpoint executed it records the following detailed information:
o The breakpoint number.
o The ECU uptime in milliseconds. This will be useful for correlating breakpoint with events in “on the road” videos.
o The contents of the stack, limited to the number of words specified in the configuration. Where it finds consecutive words on the stack that form a valid firmware address it reports them as a Long as they are most probably a return address, otherwise it reports them as Word. The code doesn’t seem to use the stack very heavily other than for return addresses, it mostly favours global variables rather than local, but it’s easy enough to work it out anyway from the source code and the data reported.
o The contents of the selected registers. These are all correct as at the point where the breakpoint was encountered (either before or after the breakpointed instruction, as defined). I’ve made sure that my own code doesn’t affect any of the values reported, even the status register and program counter. Where necessary it peeks register contents out of the stack frame used by the TRAP exception. The status register, if selected, is decoded into Trace, Supervisor, Interrupt Level and CCR flags.
o The contents of the selected variables. Variable addresses are specified as Word, and are sign extended. This covers all of the RAM addresses $0000-$1DFF plus all of the module registers in the $FFFFFXXX range. I don’t think there are any other addresses worth logging. In the report, variables are show as Hex and either Decimal (where the high bit is clear) or Signed and Unsigned (where the high bit is set). For Byte or Word variables, the individual binary bits are also shown. The application warns you if you try to define a variable at an address which does not correspond to the address of known RAM or registers as the 68000 architecture means that even reading an unimplemented memory address will likely lead to a bus fault and an ECU crash. It does not absolutely prevent you from defining such variables as I may discover additional memory-mapped regions in the future.
It only records this full level of breakpoint detail until it reaches the end of the available logging RAM, at which point it sets an overflow flag and the report just shows “...” again, but depending on the information you choose to log it can easily record full detail for 10-15 breakpoint hits, or a lot more with limited information selected. The ECU runs quite happily with breakpoints installed, so you can run the car on the road and then look at the report later (so long as you don’t power the ECU down in the meantime as the debugging report is stored in volatile in RAM). You can read and/or clear the debugging information at any time, I added a Service 31 routine to do the clearing. It’s all done through the Mapper interface.
Debugging Report
When you read the debugging report from the ECU (select Tools, ECU Tools, Debugging Report), it reads the metadata and configuration information which Mapper places in ROM as well as the RAM data, so it can work out the layout of the register data etc. without needing reference to a Mapper project, the ECU contains everything it needs. The debugging report generated is as below. This was generated using the patch configuration shown above.
The report lists the breakpoints defined. It then shows that a total of 1206 breakpoints have been executed since the ECU booted (or the debugging information was last cleared), of which 603 were breakpoint 0 and 603 were breakpoint 2 (in this case the breakpoints are in code that checks the immobilisation status of the ECU and are executed repeatedly on each pass of the main system loop). The breakpoint sequence shows that breakpoint 0, followed by breakpoint 2 is executed on each pass and breakpoint 1 has not been executed yet.
For the first 15 breakpoints encountered, the report then lists the breakpoint number, the ECU uptime, full contents of the call stack (return addresses $0012FBF4, $001258E0, $0011580E), all of the CPU register contents at the point the breakpoint was executed and the contents of the defined memory variables.
Breakpoint List:
Breakpoint 0 Address: $12FC8A, Words: 3,
Pre-Execution
Breakpoint 1 Address: $12FC92, Words: 3,
Pre-Execution
Breakpoint 2 Address: $12FCB4, Words: 3,
Pre-Execution
Breakpoint
Execution Summary:
Breakpoint Count: 1206
Breakpoint 0 Count: 603
Breakpoint 2 Count: 603
Breakpoint Sequence: 0, 2, 0, 2, 0, 2, 0, 2,
0, 2, 0, 2, 0, 2, 0, 2,
0, 2, 0, 2, 0, 2, 0, 2,
0, 2, 0, 2, 0, 2, 0, 2,
0, 2, 0, 2, 0, 2, 0, 2,
0, 2, 0, 2, 0, 2, 0, 2,
0, 2, 0, 2, 0, 2, 0, 2,
0, 2, 0, 2, 0, 2, 0, 2,
0, 2, 0, 2, 0, 2, 0, 2,
0, 2, 0, 2, 0, 2, 0, 2,
0, 2, 0, 2, 0, 2, 0, 2,
0, 2, 0, 2, 0, 2, 0, 2,
0, 2, 0, 2, 0, 2, 0, 2,
0, 2, 0, 2, 0, 2, 0, 2,
0, 2, 0, 2, 0, 2, 0, 2,
0, 2, 0, 2, 0, 2, 0, 2,
0, 2, 0, 2, 0, 2, 0, 2,
0, 2, 0, 2, 0, 2, 0, 2,
0, 2, 0, 2, 0, 2, 0, 2,
0, 2, 0, 2, 0, 2, 0, 2,
0, 2, 0, 2, 0, 2, 0, 2,
0, 2, 0, 2, 0, 2, 0, 2,
0, 2, 0, 2, 0, 2, 0, 2,
0, 2, 0, 2, 0, 2, 0, 2,
0, 2, 0, 2, 0, 2, 0, 2,
0, 2, 0, 2, 0, 2, 0, 2,
0, 2, 0, 2, 0, 2, 0, 2,
0, 2, 0, 2, 0, 2, 0, 2,
0, 2, 0, 2, 0, 2, 0, 2,
0, 2, 0, 2, 0, 2, 0, 2,
0, 2,
0, 2, 0, 2, 0, 2, 0, 2, 0, 2, 0, 2, 0, 2 ... and 950 more.
Breakpoint
#0:
Breakpoint: 0
ECU Uptime: 00:00:00.014
Stack Dump: $0012FBF4, $001258E0, $0011580E
Registers:
D0=$00000000, D1=$00000001, D2=$0119091C, D3=$00001542,
D4=$00000000, D5=$00000001,
D6=$0FA0FF9C, D7=$1C200000,
A0=$0012FC32, A1=$0013F246,
A2=$000009B8, A3=$000009D8,
A4=$00000EC8, A5=$0013C000,
A6=$FFFFFFFF, SP=$000003D4,
PC=$0012FC8C, SR=$201D, T=0, S=1,
IP=0, X=1, N=1, Z=1, V=0, C=1
Variables:
($1320)=$0000, Decimal=0,
Bits=0000,0000,0000,0000
($0540)=$0000, Decimal=0,
Bits=0000,0000,0000,0000
Breakpoint
#1:
Breakpoint: 2
ECU Uptime: 00:00:00.014
Stack Dump: $0012FBF4, $001258E0, $0011580E
Registers:
D0=$00000000, D1=$00000001, D2=$0119091C, D3=$00001542,
D4=$00000000, D5=$00000001,
D6=$0FA0FF9C, D7=$1C200000,
A0=$0012FC32, A1=$0013F246,
A2=$000009B8, A3=$000009D8,
A4=$00000EC8, A5=$0013C000,
A6=$FFFFFFFF, SP=$000003D4,
PC=$0012FCB6, SR=$201D, T=0, S=1,
IP=0, X=1, N=1, Z=1, V=0, C=1
Variables:
($1320)=$0000, Decimal=0,
Bits=0000,0000,0000,0000
($0540)=$0000, Decimal=0,
Bits=0000,0000,0000,0000
Breakpoint
#2:
Breakpoint: 0
ECU Uptime: 00:00:00.021
Stack Dump: $0012FBF4, $001258E0, $0011580E
Registers:
D0=$00000000, D1=$00000001, D2=$0119091C, D3=$0000151F,
D4=$00000000, D5=$00000001,
D6=$0FA0FF9C, D7=$1C200000,
A0=$0012FC32, A1=$0013F246,
A2=$000009B8, A3=$000009D8,
A4=$00000EC8, A5=$0013C000,
A6=$FFFFFFFF, SP=$000003D4,
PC=$0012FC8C, SR=$201D, T=0, S=1,
IP=0, X=1, N=1, Z=1, V=0, C=1
Variables:
($1320)=$0000, Decimal=0,
Bits=0000,0000,0000,0000
($0540)=$0000, Decimal=0,
Bits=0000,0000,0000,0000
Breakpoint
#3:
Breakpoint: 2
ECU Uptime: 00:00:00.021
Stack Dump: $0012FBF4, $001258E0, $0011580E
Registers:
D0=$00000000, D1=$00000001, D2=$0119091C, D3=$0000151F,
D4=$00000000, D5=$00000001,
D6=$0FA0FF9C, D7=$1C200000,
A0=$0012FC32, A1=$0013F246,
A2=$000009B8, A3=$000009D8,
A4=$00000EC8, A5=$0013C000,
A6=$FFFFFFFF, SP=$000003D4,
PC=$0012FCB6, SR=$201D, T=0, S=1,
IP=0, X=1, N=1, Z=1, V=0, C=1
Variables:
($1320)=$0000, Decimal=0, Bits=0000,0000,0000,0000
($0540)=$0000, Decimal=0,
Bits=0000,0000,0000,0000
Breakpoint
#4:
Breakpoint: 0
ECU Uptime: 00:00:00.028
Stack Dump: $0012FBF4, $001258E0, $0011580E
Registers:
D0=$00000000, D1=$00000001, D2=$0119091C, D3=$0000150E,
D4=$00000000, D5=$00000001,
D6=$0FA0FF9C, D7=$1C200000,
A0=$0012FC32, A1=$0013F246,
A2=$000009B8, A3=$000009D8,
A4=$00000EC8, A5=$0013C000,
A6=$FFFFFFFF, SP=$000003D4,
PC=$0012FC8C, SR=$201D, T=0, S=1,
IP=0, X=1, N=1, Z=1, V=0, C=1
Variables:
($1320)=$0000, Decimal=0,
Bits=0000,0000,0000,0000
($0540)=$0000, Decimal=0,
Bits=0000,0000,0000,0000
Breakpoint
#5:
Breakpoint: 2
ECU Uptime: 00:00:00.028
Stack Dump: $0012FBF4, $001258E0, $0011580E
Registers:
D0=$00000000, D1=$00000001, D2=$0119091C, D3=$0000150E,
D4=$00000000, D5=$00000001,
D6=$0FA0FF9C, D7=$1C200000,
A0=$0012FC32, A1=$0013F246,
A2=$000009B8, A3=$000009D8,
A4=$00000EC8, A5=$0013C000,
A6=$FFFFFFFF, SP=$000003D4,
PC=$0012FCB6, SR=$201D, T=0, S=1,
IP=0, X=1, N=1, Z=1, V=0, C=1
Variables:
($1320)=$0000, Decimal=0,
Bits=0000,0000,0000,0000
($0540)=$0000, Decimal=0,
Bits=0000,0000,0000,0000
Breakpoint
#6:
Breakpoint: 0
ECU Uptime: 00:00:00.035
Stack Dump: $0012FBF4, $001258E0, $0011580E
Registers:
D0=$00000000, D1=$00000001, D2=$0119091C, D3=$00001500,
D4=$00000000, D5=$00000001, D6=$0FA0FF9C,
D7=$1C200000,
A0=$0012FC32, A1=$0013F246,
A2=$000009B8, A3=$000009D8,
A4=$00000EC8, A5=$0013C000,
A6=$FFFFFFFF, SP=$000003D4,
PC=$0012FC8C, SR=$201D, T=0, S=1,
IP=0, X=1, N=1, Z=1, V=0, C=1
Variables:
($1320)=$0000, Decimal=0,
Bits=0000,0000,0000,0000
($0540)=$0000, Decimal=0,
Bits=0000,0000,0000,0000
Breakpoint
#7:
Breakpoint: 2
ECU Uptime: 00:00:00.036
Stack Dump: $0012FBF4, $001258E0, $0011580E
Registers:
D0=$00000000, D1=$00000001, D2=$0119091C, D3=$00001500,
D4=$00000000, D5=$00000001,
D6=$0FA0FF9C, D7=$1C200000,
A0=$0012FC32, A1=$0013F246,
A2=$000009B8, A3=$000009D8,
A4=$00000EC8, A5=$0013C000,
A6=$FFFFFFFF, SP=$000003D4,
PC=$0012FCB6, SR=$201D, T=0, S=1,
IP=0, X=1, N=1, Z=1, V=0, C=1
Variables:
($1320)=$0000, Decimal=0,
Bits=0000,0000,0000,0000
($0540)=$0000, Decimal=0,
Bits=0000,0000,0000,0000
Breakpoint
#8:
Breakpoint: 0
ECU Uptime: 00:00:00.044
Stack Dump: $0012FBF4, $001258E0, $0011580E
Registers:
D0=$00000000, D1=$00000001, D2=$0119091C, D3=$000014F6,
D4=$00000000, D5=$00000001,
D6=$0FA0FF9C, D7=$1C200000,
A0=$0012FC32, A1=$0013F246,
A2=$000009B8, A3=$000009D8,
A4=$00000EC8, A5=$0013C000,
A6=$FFFFFFFF, SP=$000003D4,
PC=$0012FC8C, SR=$201D, T=0, S=1,
IP=0, X=1, N=1, Z=1, V=0, C=1
Variables:
($1320)=$0000, Decimal=0,
Bits=0000,0000,0000,0000
($0540)=$0000, Decimal=0, Bits=0000,0000,0000,0000
Breakpoint
#9:
Breakpoint: 2
ECU Uptime: 00:00:00.044
Stack Dump: $0012FBF4, $001258E0, $0011580E
Registers:
D0=$00000000, D1=$00000001, D2=$0119091C, D3=$000014F6,
D4=$00000000, D5=$00000001,
D6=$0FA0FF9C, D7=$1C200000,
A0=$0012FC32, A1=$0013F246,
A2=$000009B8, A3=$000009D8,
A4=$00000EC8, A5=$0013C000,
A6=$FFFFFFFF, SP=$000003D4,
PC=$0012FCB6, SR=$201D, T=0, S=1,
IP=0, X=1, N=1, Z=1, V=0, C=1
Variables:
($1320)=$0000, Decimal=0,
Bits=0000,0000,0000,0000
($0540)=$0000, Decimal=0,
Bits=0000,0000,0000,0000
Breakpoint
#10:
Breakpoint: 0
ECU Uptime: 00:00:00.051
Stack Dump: $0012FBF4, $001258E0, $0011580E
Registers:
D0=$00000000, D1=$00000001, D2=$0119091C, D3=$000014F2,
D4=$00000000, D5=$00000001,
D6=$0FA0FF9C, D7=$1C200000,
A0=$0012FC32, A1=$0013F246,
A2=$000009B8, A3=$000009D8,
A4=$00000EC8, A5=$0013C000, A6=$FFFFFFFF,
SP=$000003D4,
PC=$0012FC8C, SR=$201D, T=0, S=1,
IP=0, X=1, N=1, Z=1, V=0, C=1
Variables:
($1320)=$0000, Decimal=0,
Bits=0000,0000,0000,0000
($0540)=$0000, Decimal=0,
Bits=0000,0000,0000,0000
Breakpoint
#11:
Breakpoint: 2
ECU Uptime: 00:00:00.051
Stack Dump: $0012FBF4, $001258E0, $0011580E
Registers:
D0=$00000000, D1=$00000001, D2=$0119091C, D3=$000014F2,
D4=$00000000, D5=$00000001,
D6=$0FA0FF9C, D7=$1C200000,
A0=$0012FC32, A1=$0013F246,
A2=$000009B8, A3=$000009D8,
A4=$00000EC8, A5=$0013C000,
A6=$FFFFFFFF, SP=$000003D4,
PC=$0012FCB6, SR=$201D, T=0, S=1,
IP=0, X=1, N=1, Z=1, V=0, C=1
Variables:
($1320)=$0000, Decimal=0,
Bits=0000,0000,0000,0000
($0540)=$0000, Decimal=0,
Bits=0000,0000,0000,0000
Breakpoint
#12:
Breakpoint: 0
ECU Uptime: 00:00:00.058
Stack Dump: $0012FBF4, $001258E0, $0011580E
Registers:
D0=$00000000, D1=$00000001, D2=$0119091C, D3=$000014EF,
D4=$00000000, D5=$00000001,
D6=$0FA0FF9C, D7=$1C200000,
A0=$0012FC32, A1=$0013F246,
A2=$000009B8, A3=$000009D8,
A4=$00000EC8, A5=$0013C000,
A6=$FFFFFFFF, SP=$000003D4,
PC=$0012FC8C, SR=$201D, T=0, S=1,
IP=0, X=1, N=1, Z=1, V=0, C=1
Variables:
($1320)=$0000, Decimal=0,
Bits=0000,0000,0000,0000
($0540)=$0000, Decimal=0,
Bits=0000,0000,0000,0000
Breakpoint
#13:
Breakpoint: 2
ECU Uptime: 00:00:00.058
Stack
Dump: $0012FBF4, $001258E0, $0011580E
Registers:
D0=$00000000, D1=$00000001, D2=$0119091C, D3=$000014EF,
D4=$00000000, D5=$00000001,
D6=$0FA0FF9C, D7=$1C200000,
A0=$0012FC32, A1=$0013F246,
A2=$000009B8, A3=$000009D8,
A4=$00000EC8, A5=$0013C000,
A6=$FFFFFFFF, SP=$000003D4,
PC=$0012FCB6, SR=$201D, T=0, S=1,
IP=0, X=1, N=1, Z=1, V=0, C=1
Variables:
($1320)=$0000, Decimal=0,
Bits=0000,0000,0000,0000
($0540)=$0000, Decimal=0,
Bits=0000,0000,0000,0000
Breakpoint
#14:
Breakpoint: 0
ECU Uptime: 00:00:00.065
Stack Dump: $0012FBF4, $001258E0, $0011580E
Registers:
D0=$00000000, D1=$00000001, D2=$0119091C, D3=$000014EB,
D4=$00000000, D5=$00000001,
D6=$0FA0FF9C, D7=$1C200000,
A0=$0012FC32, A1=$0013F246,
A2=$000009B8, A3=$000009D8,
A4=$00000EC8, A5=$0013C000,
A6=$FFFFFFFF, SP=$000003D4
... out of debugging
RAM.